


5
Urban Visual Clusters & Road Transport Fatalities - A Global City-level Image Analysis
3
Urban Visual Intelligence

3
Great Streets

1
Food Battle
2
Jaywalking

5
Rhythm of Transit Stations
2
O2O

2
Desirable streets

4
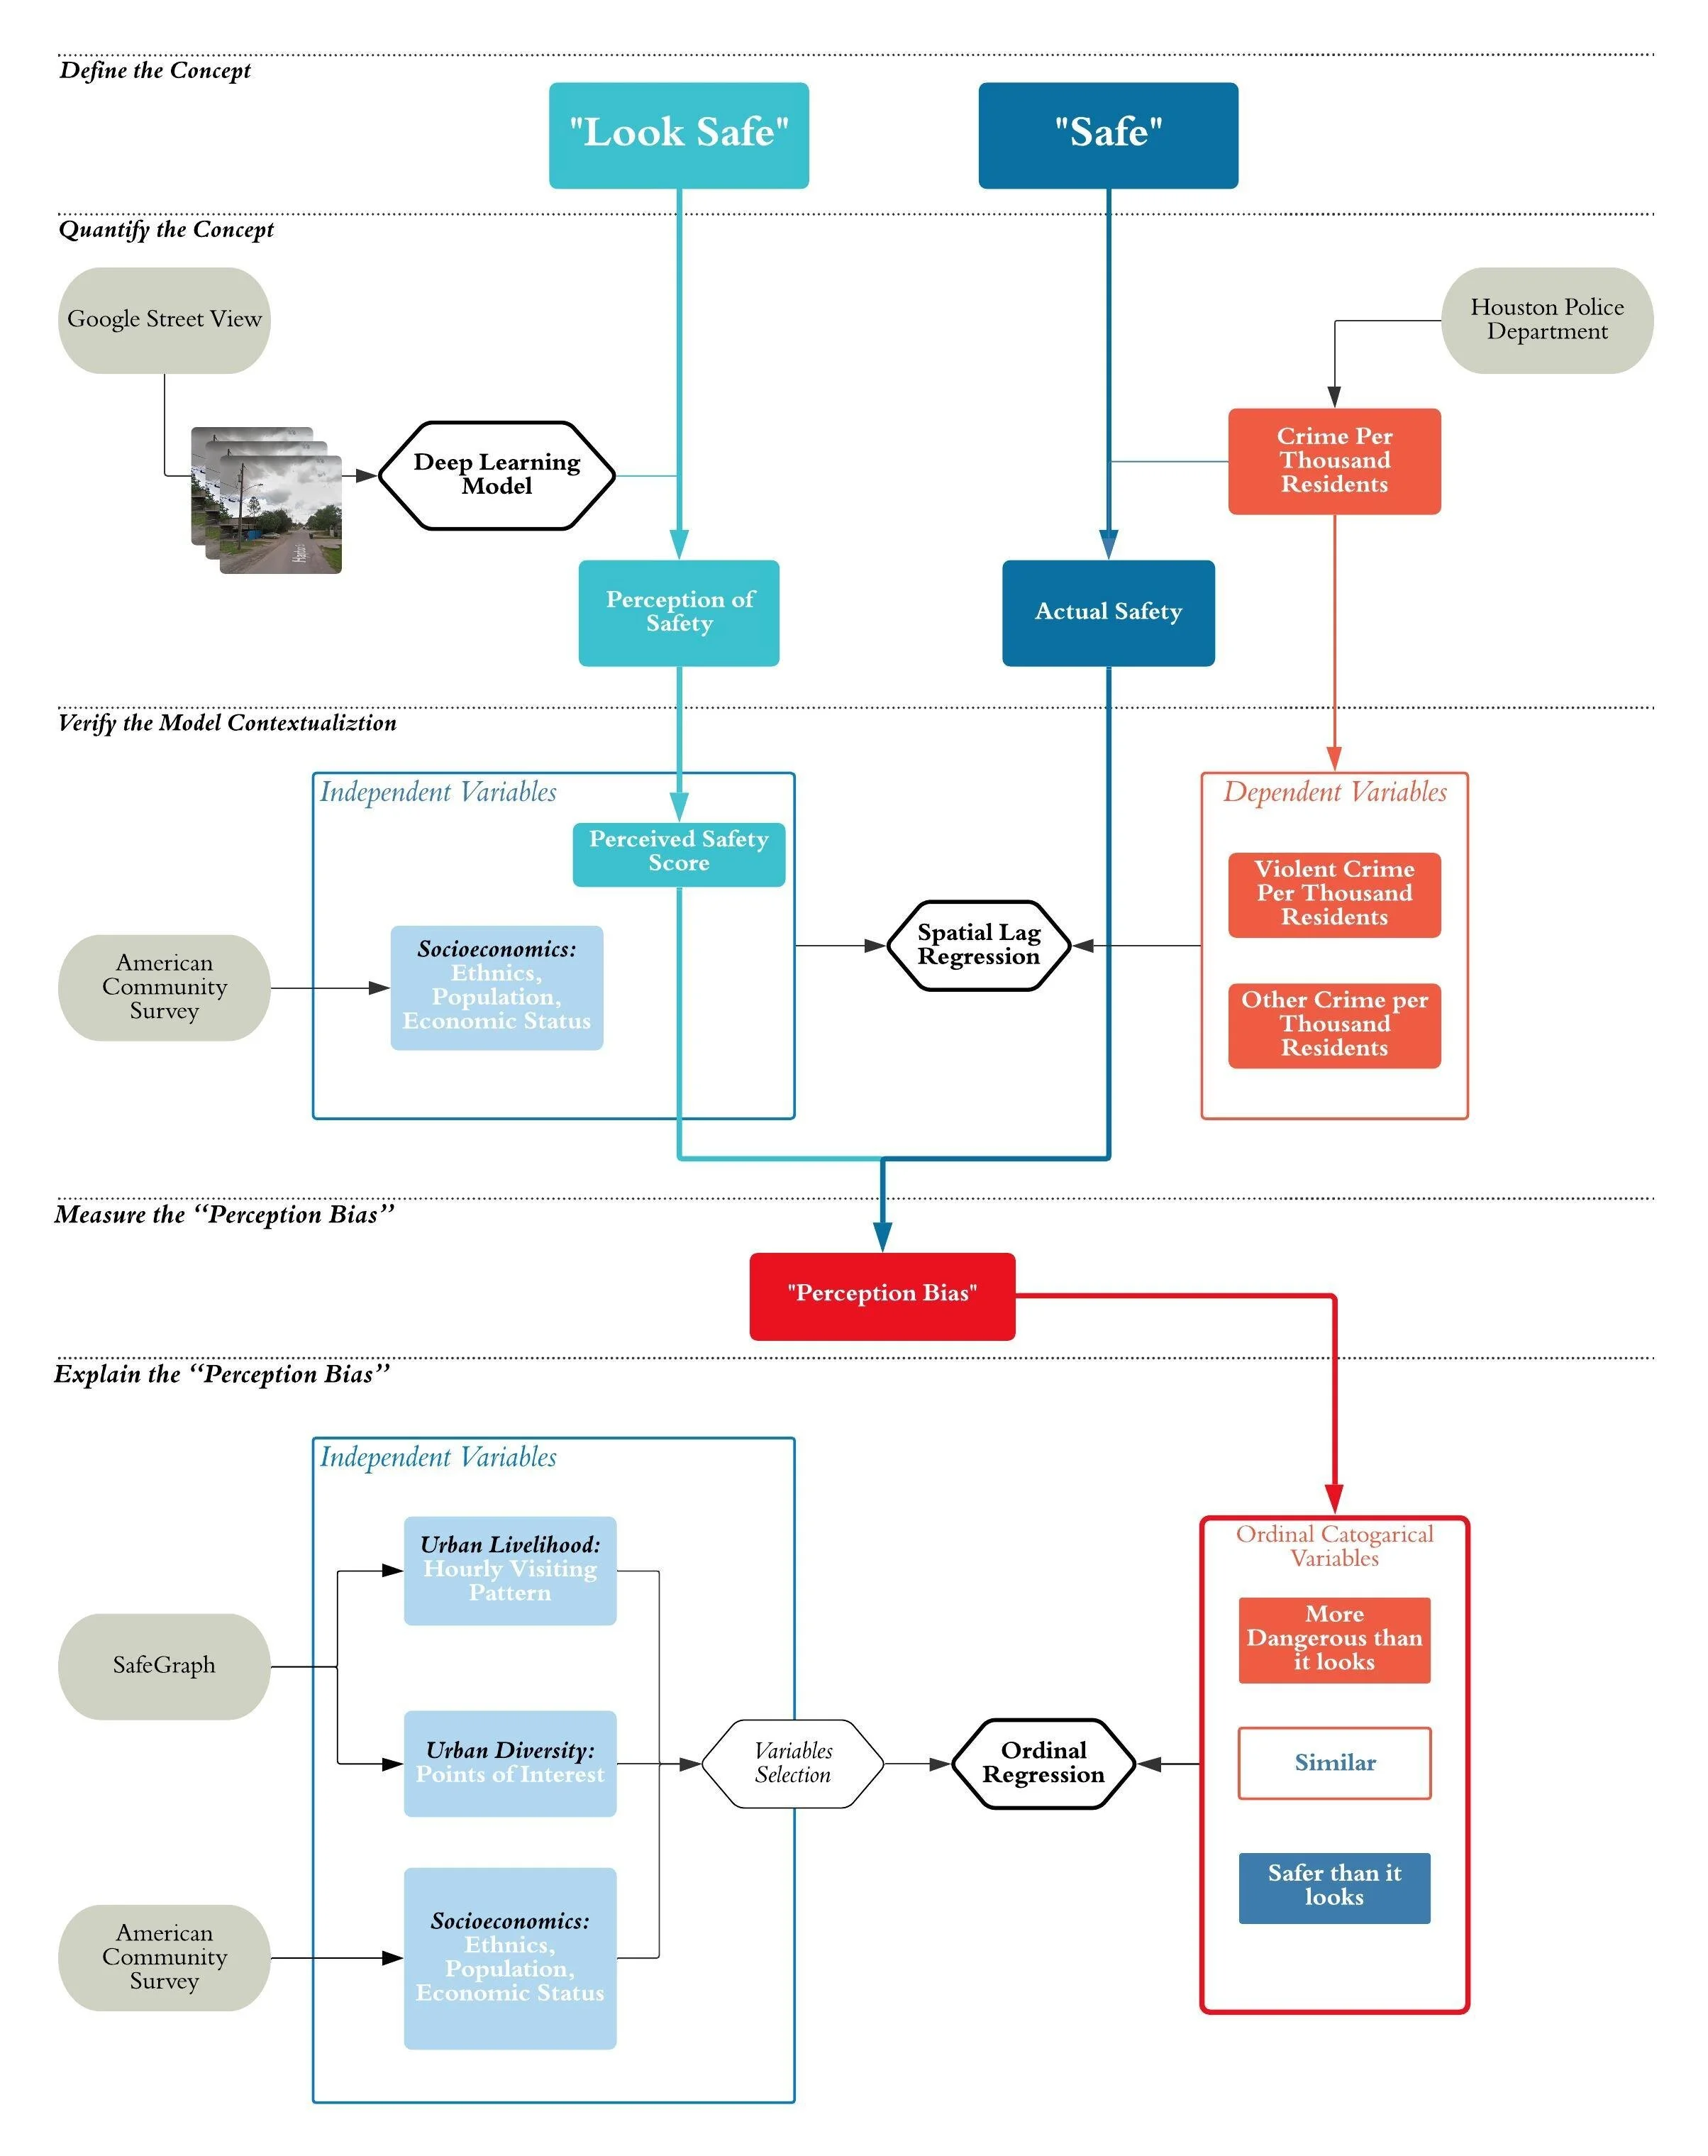
Perception Bias

2
Covid-19 and Cities

2
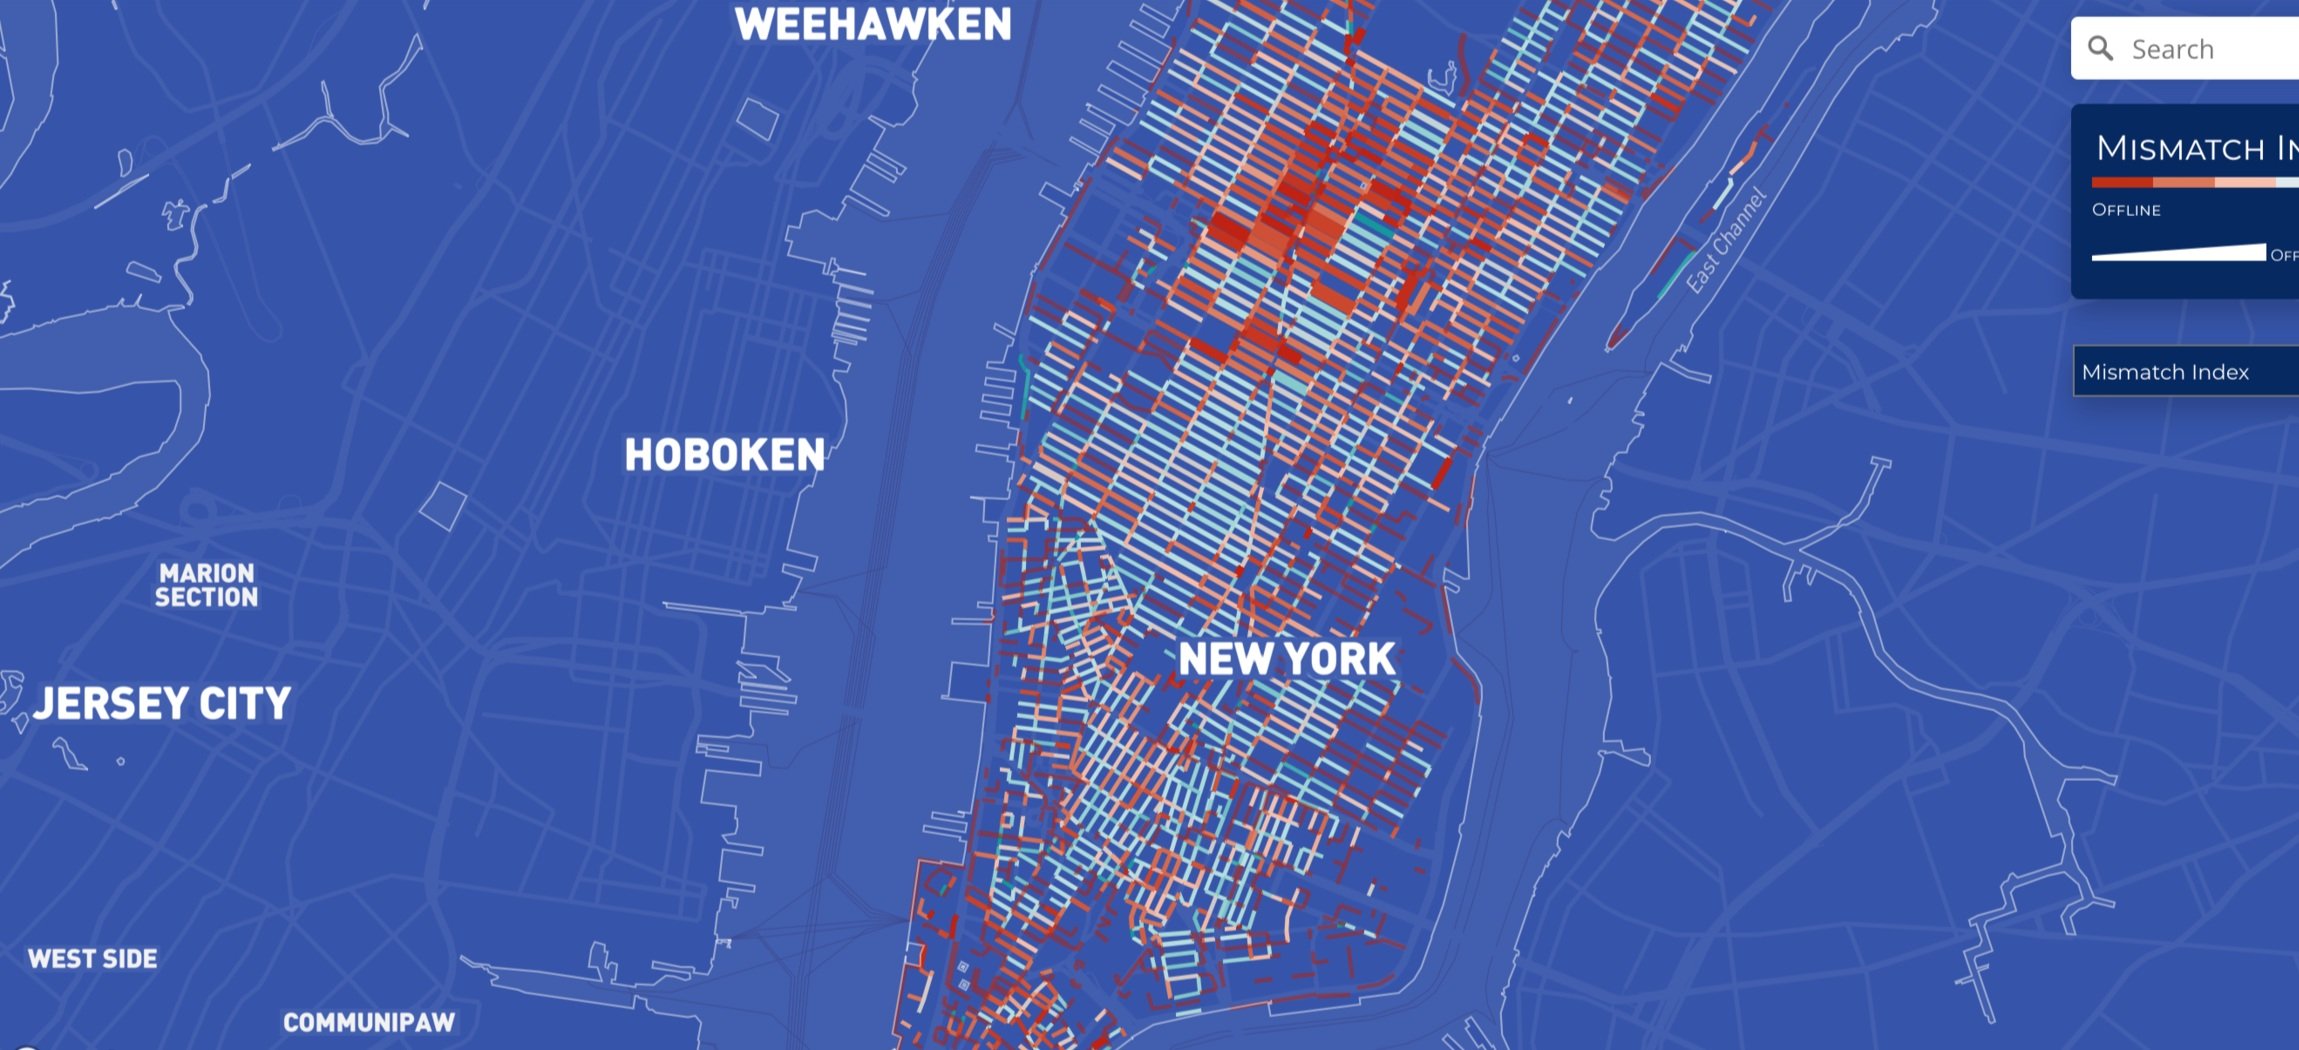
Fiber to The Home

4
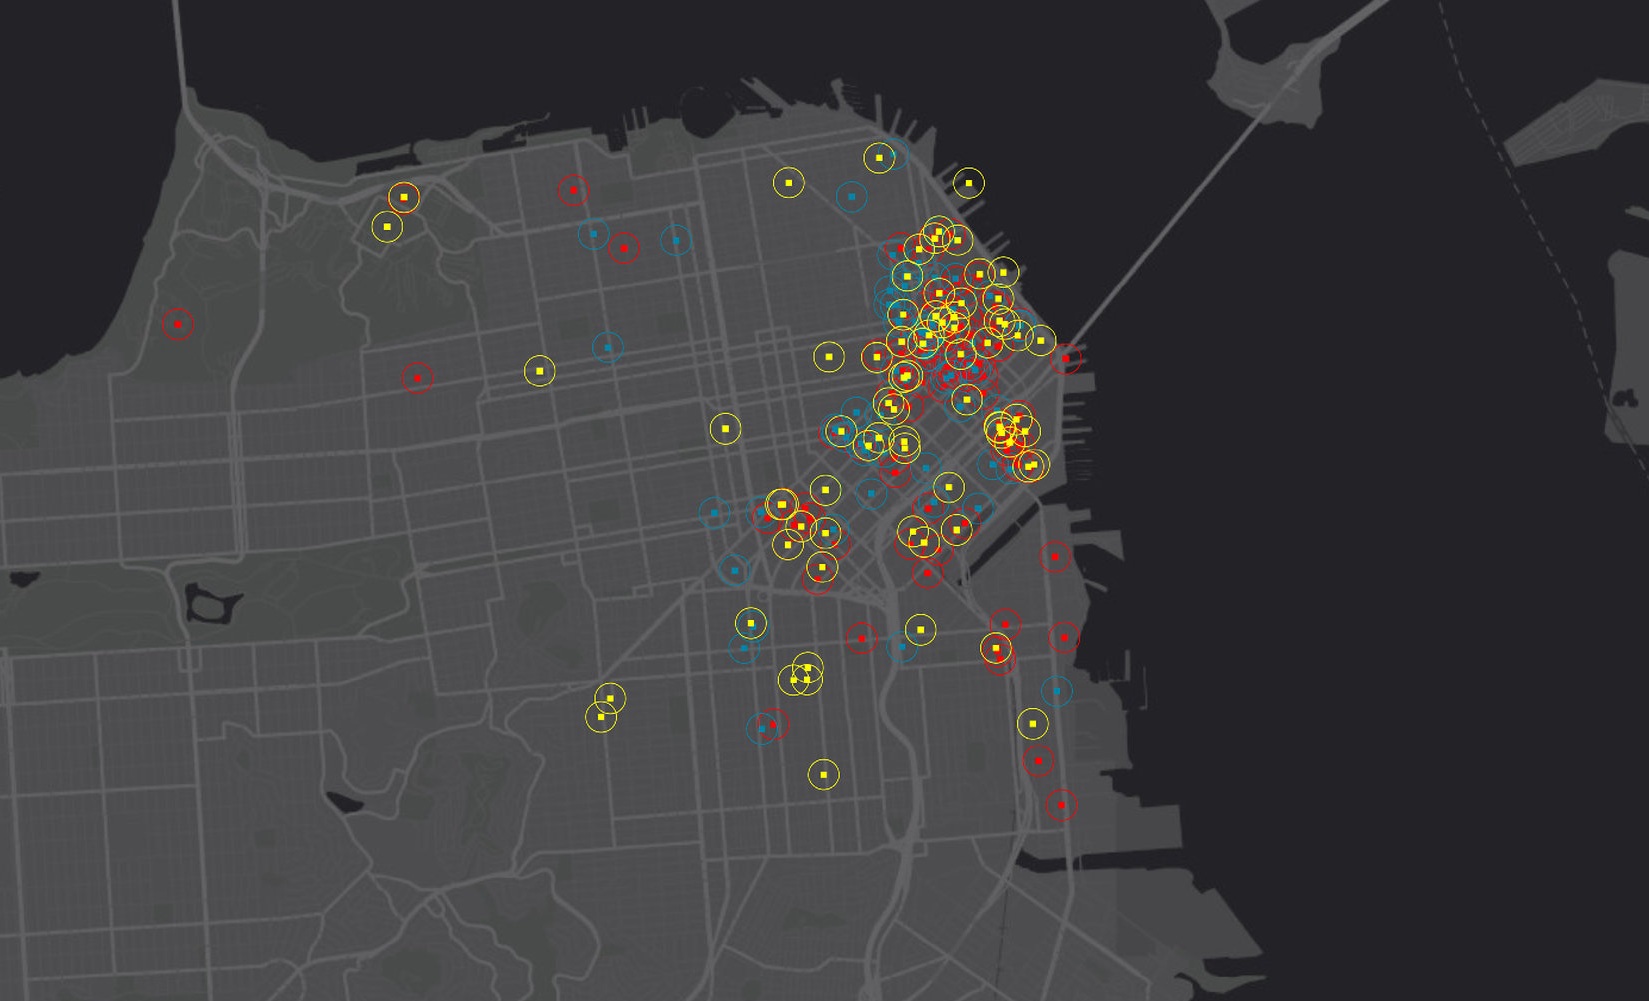
Tasty City
4
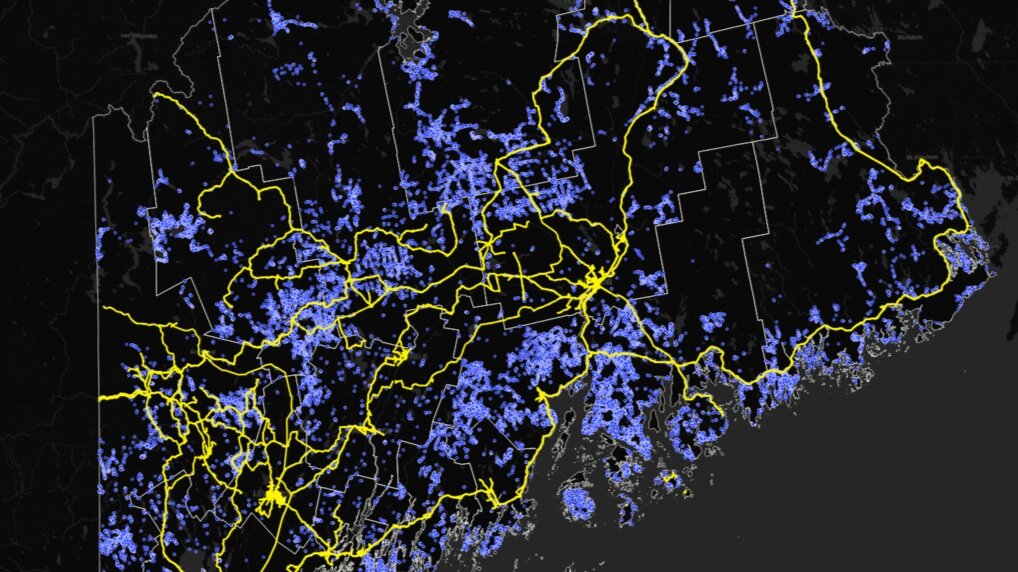
Light Maine

5
Rentify Chinatown

4
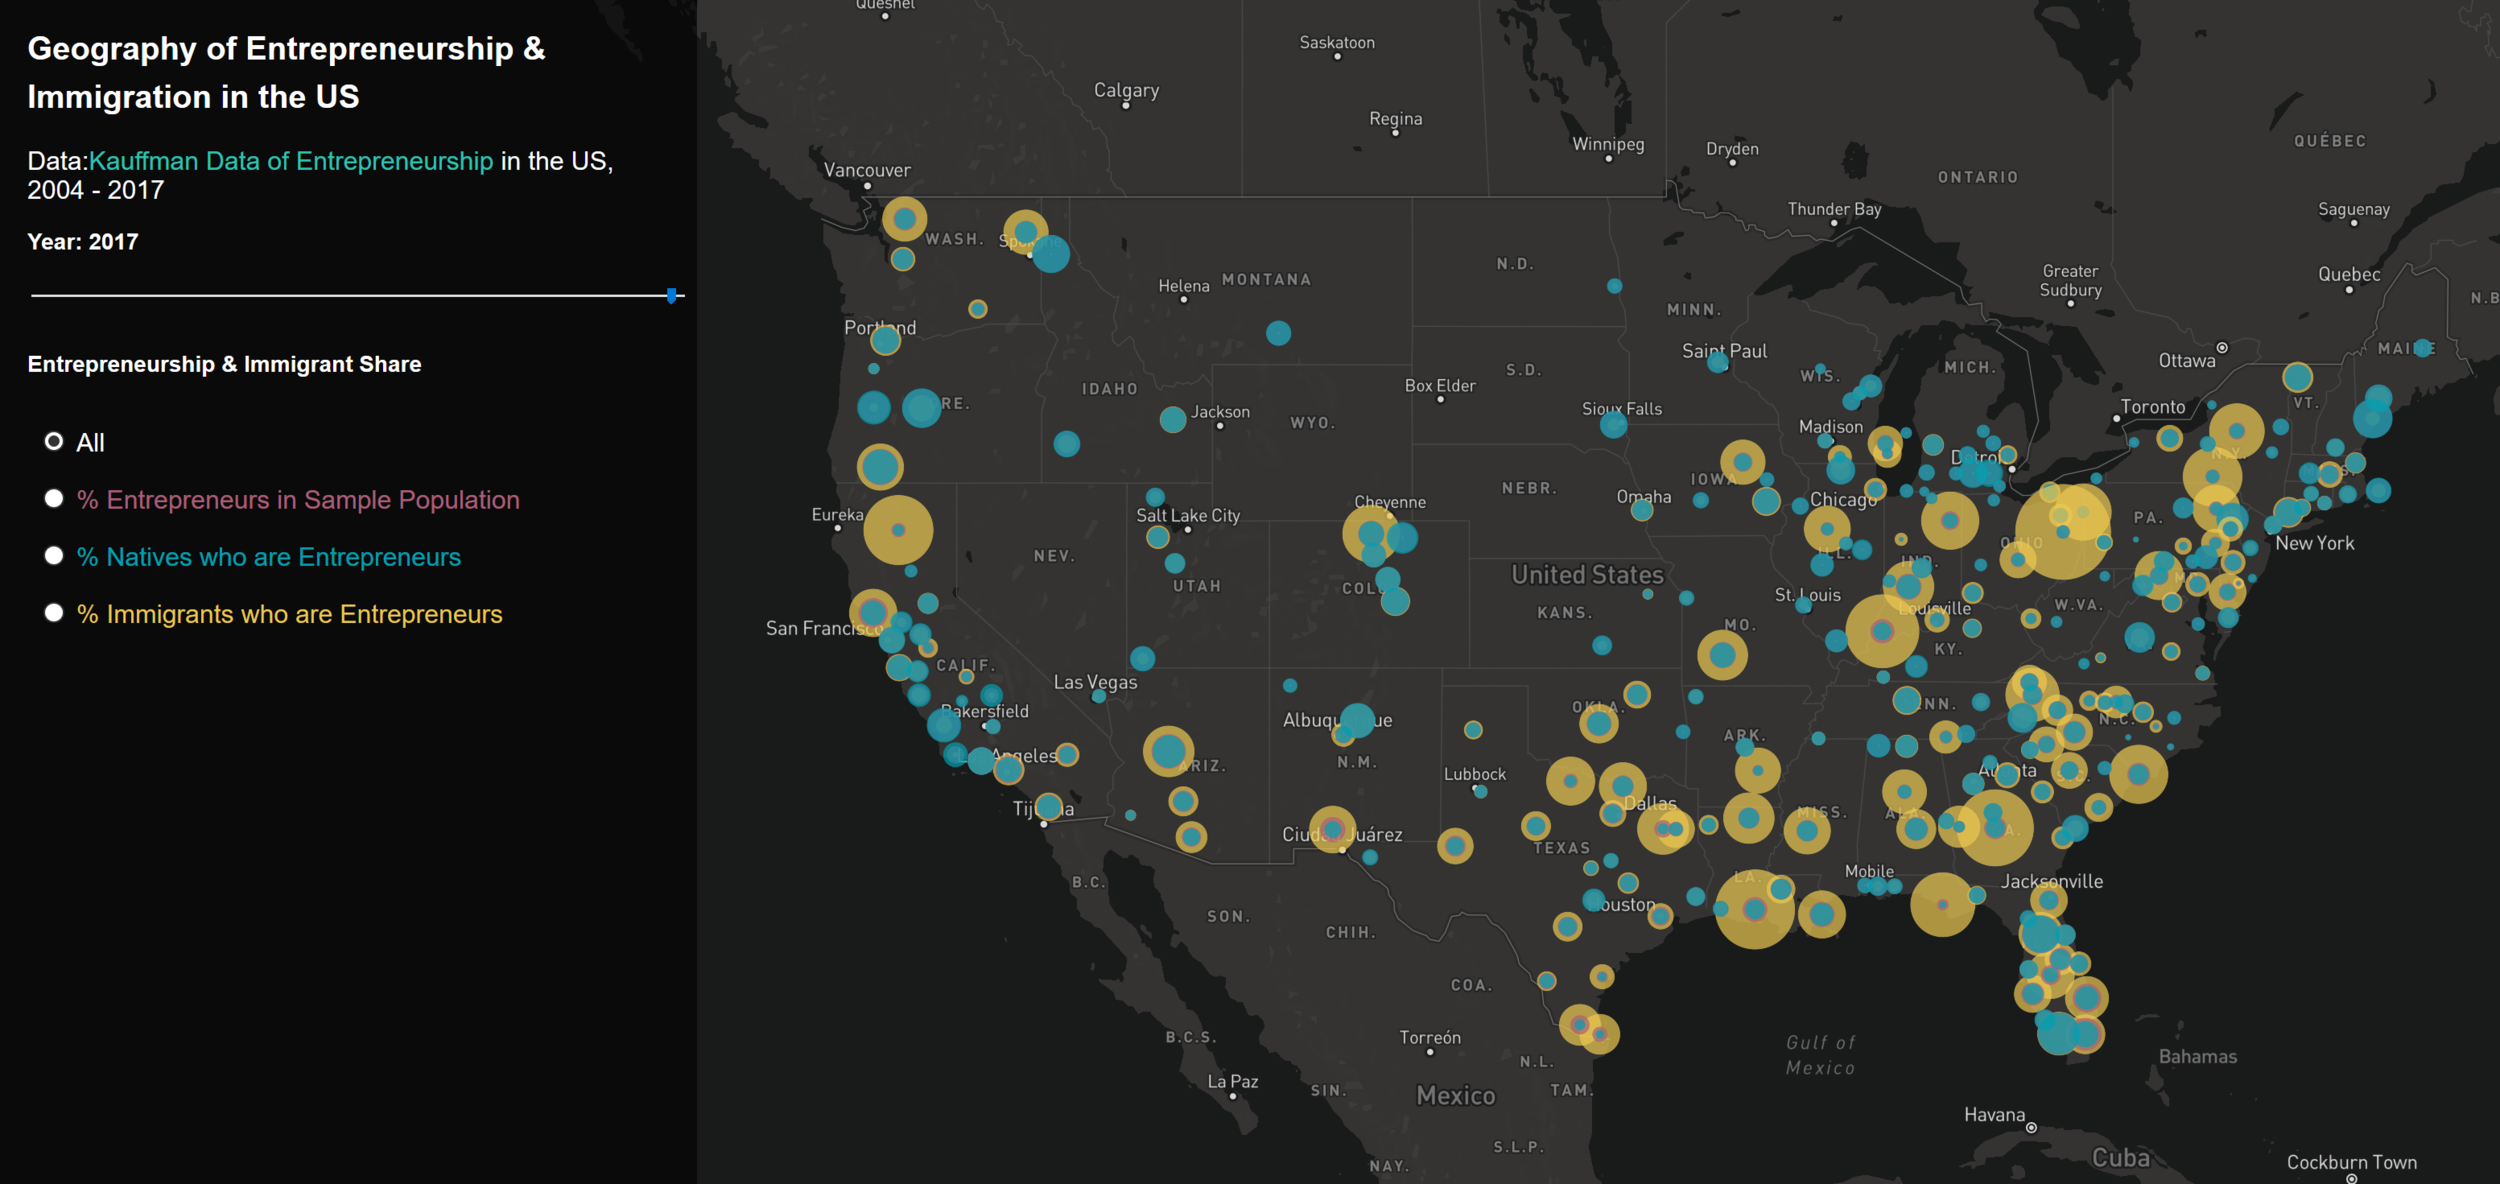
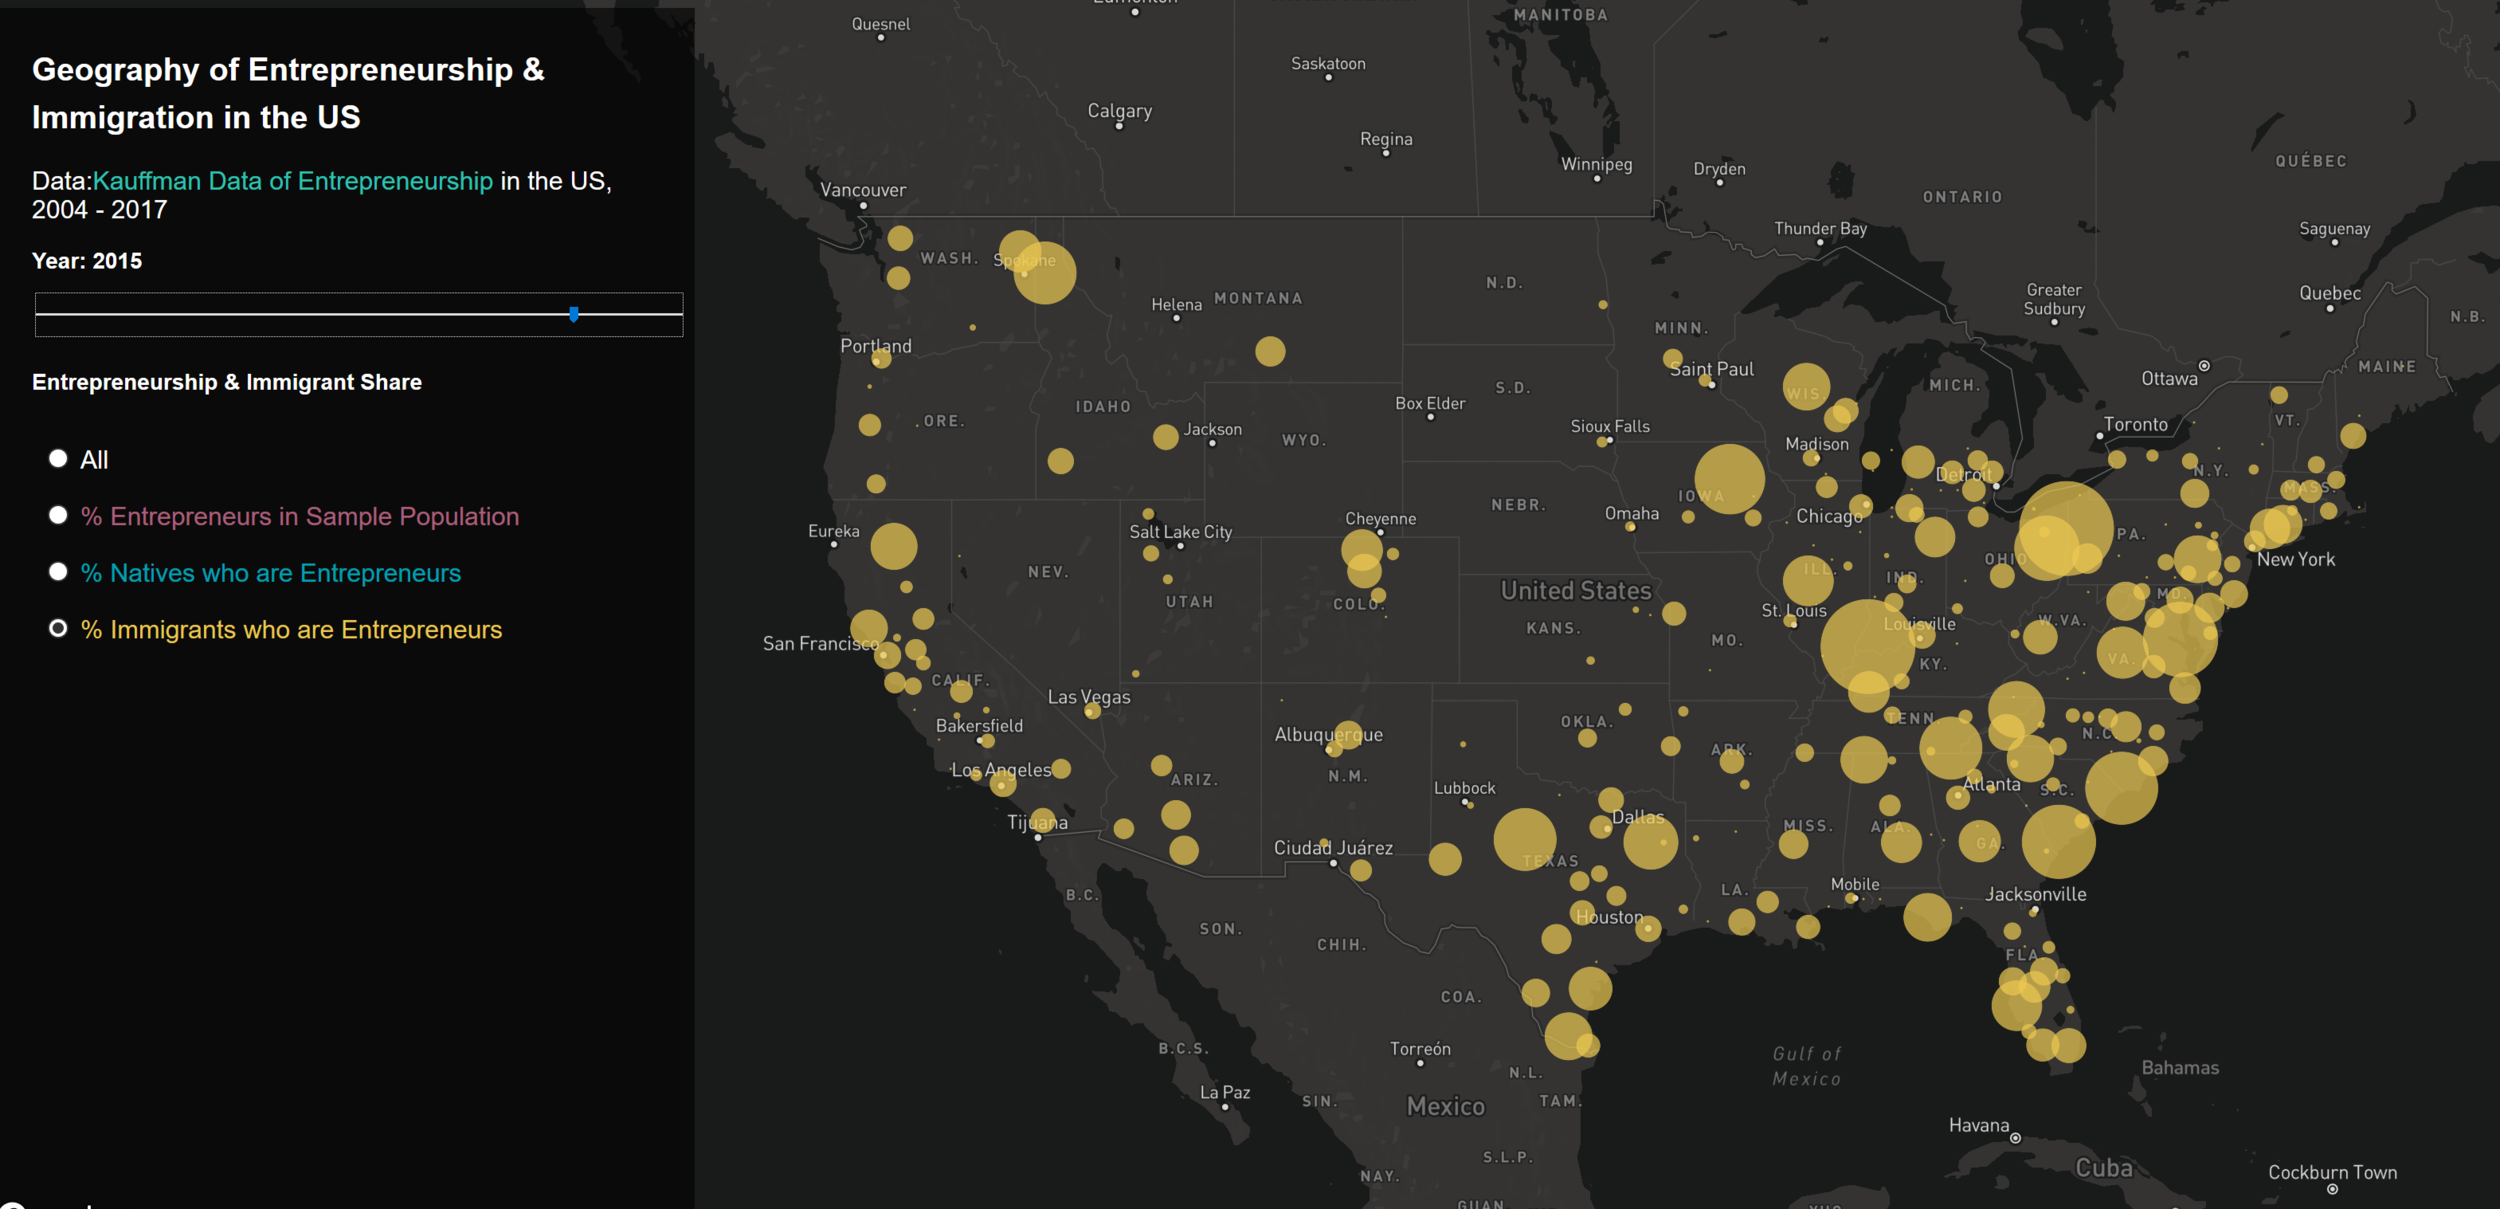
Immigration Led Innovation
4
The Chosen Sites

2
Illuminated Wind
8
The Hills at Vallco

3
Path or Stream?
2
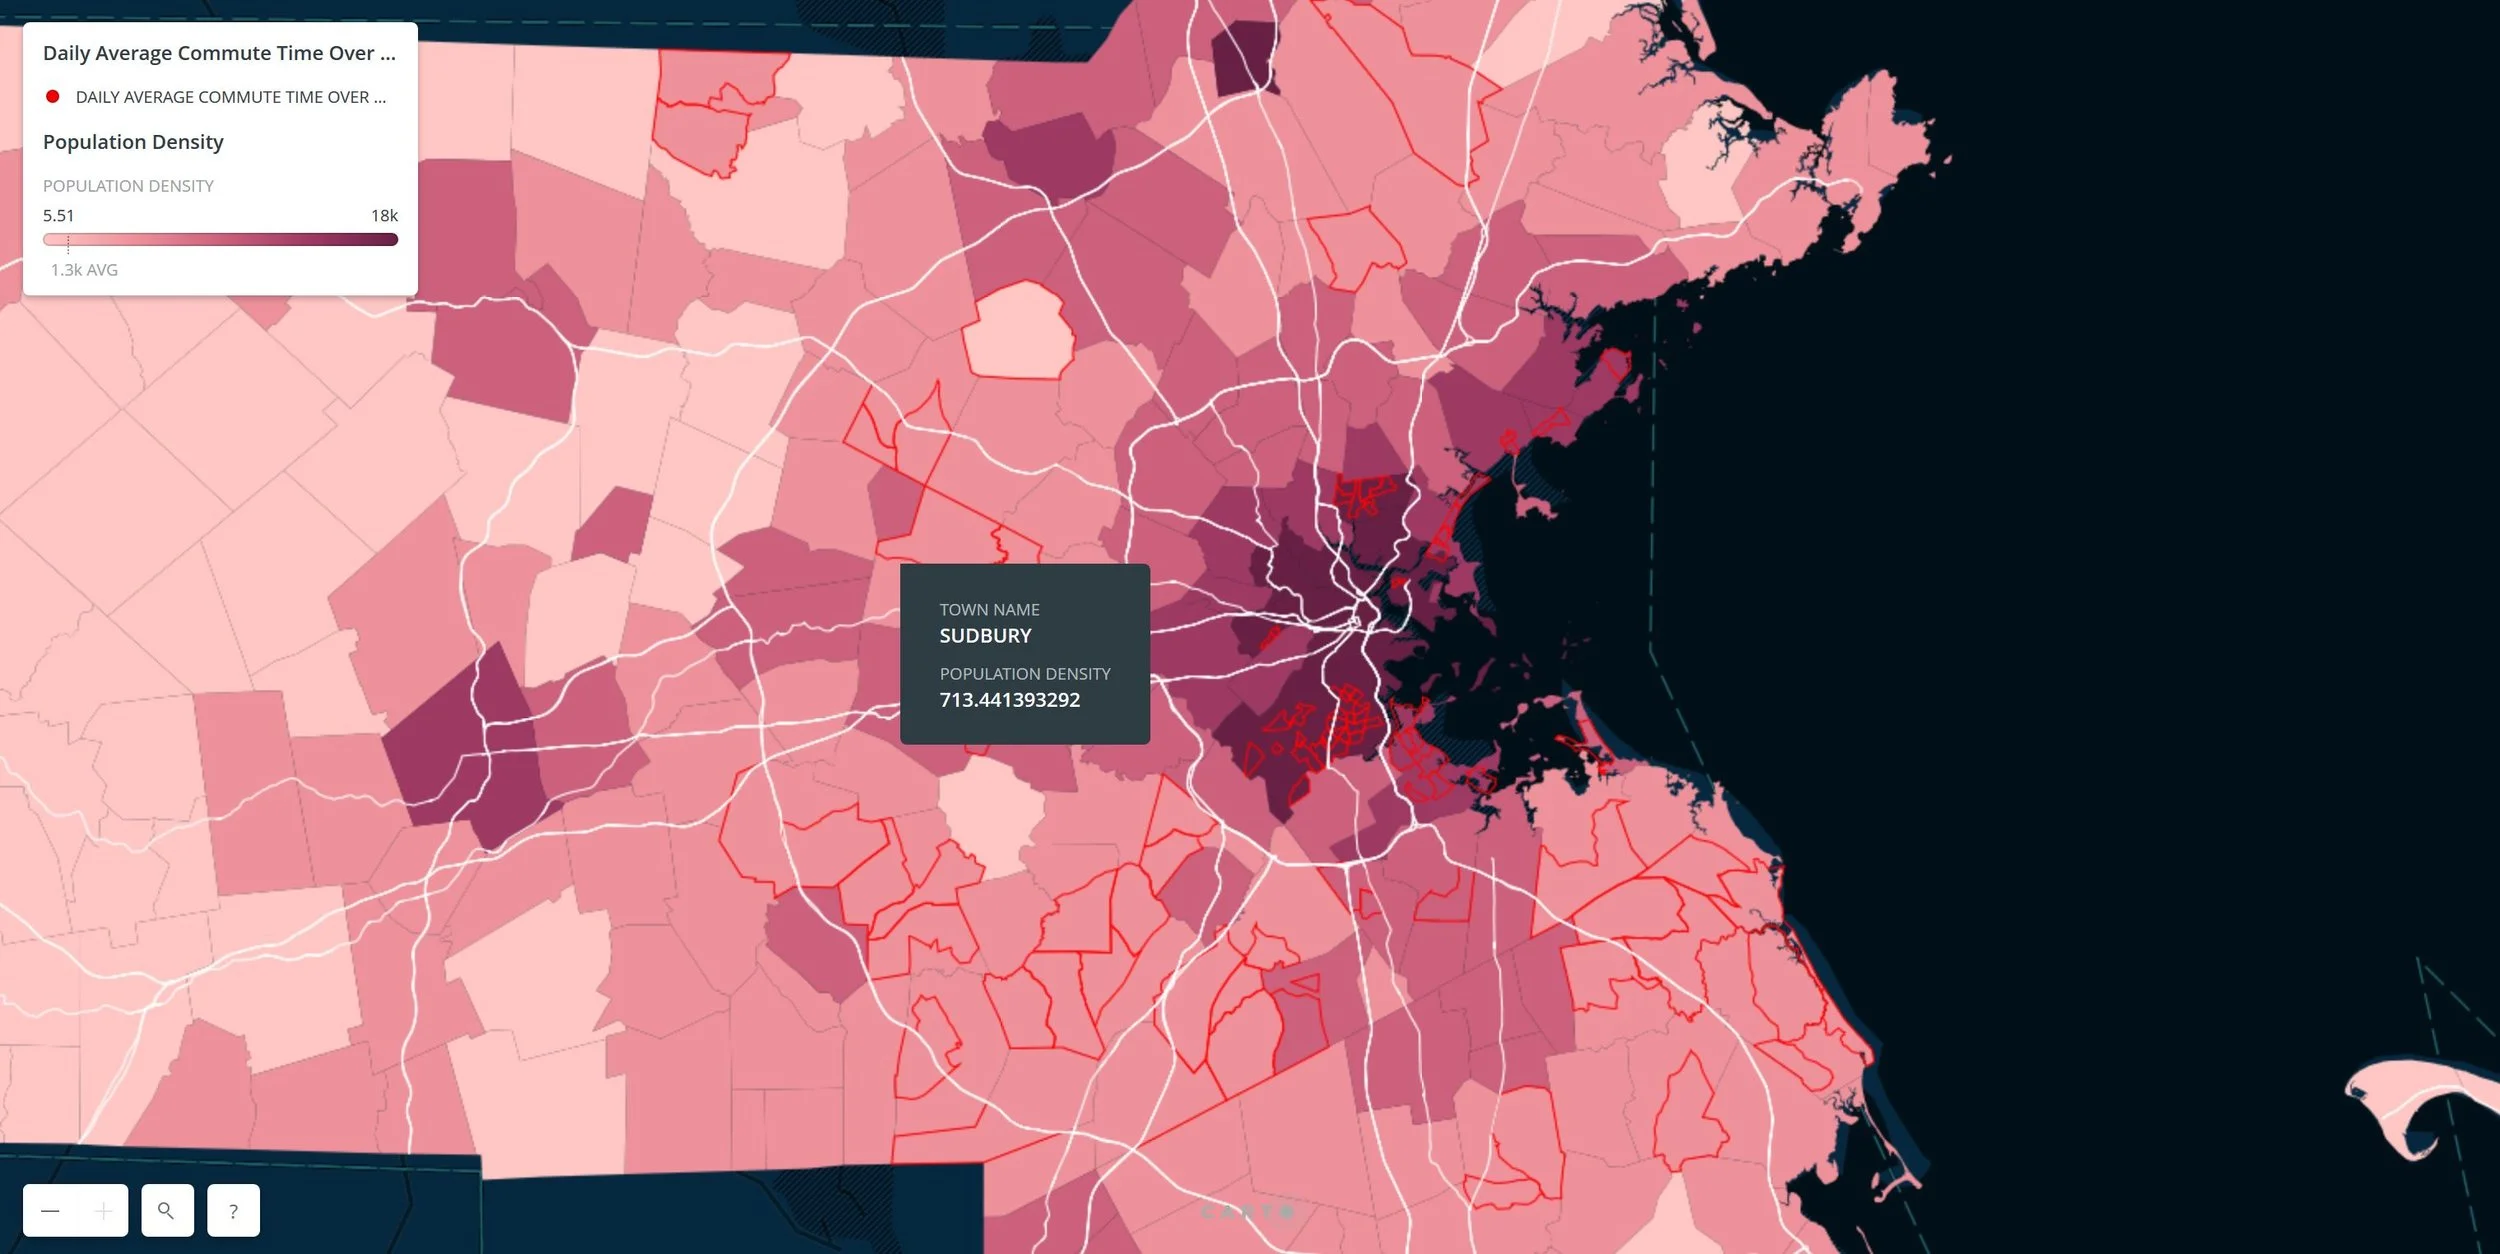
Commute @ Boston

3
Splice @ Maple, India

7
Pedaling Plant

7
Ecologic Multiple Park

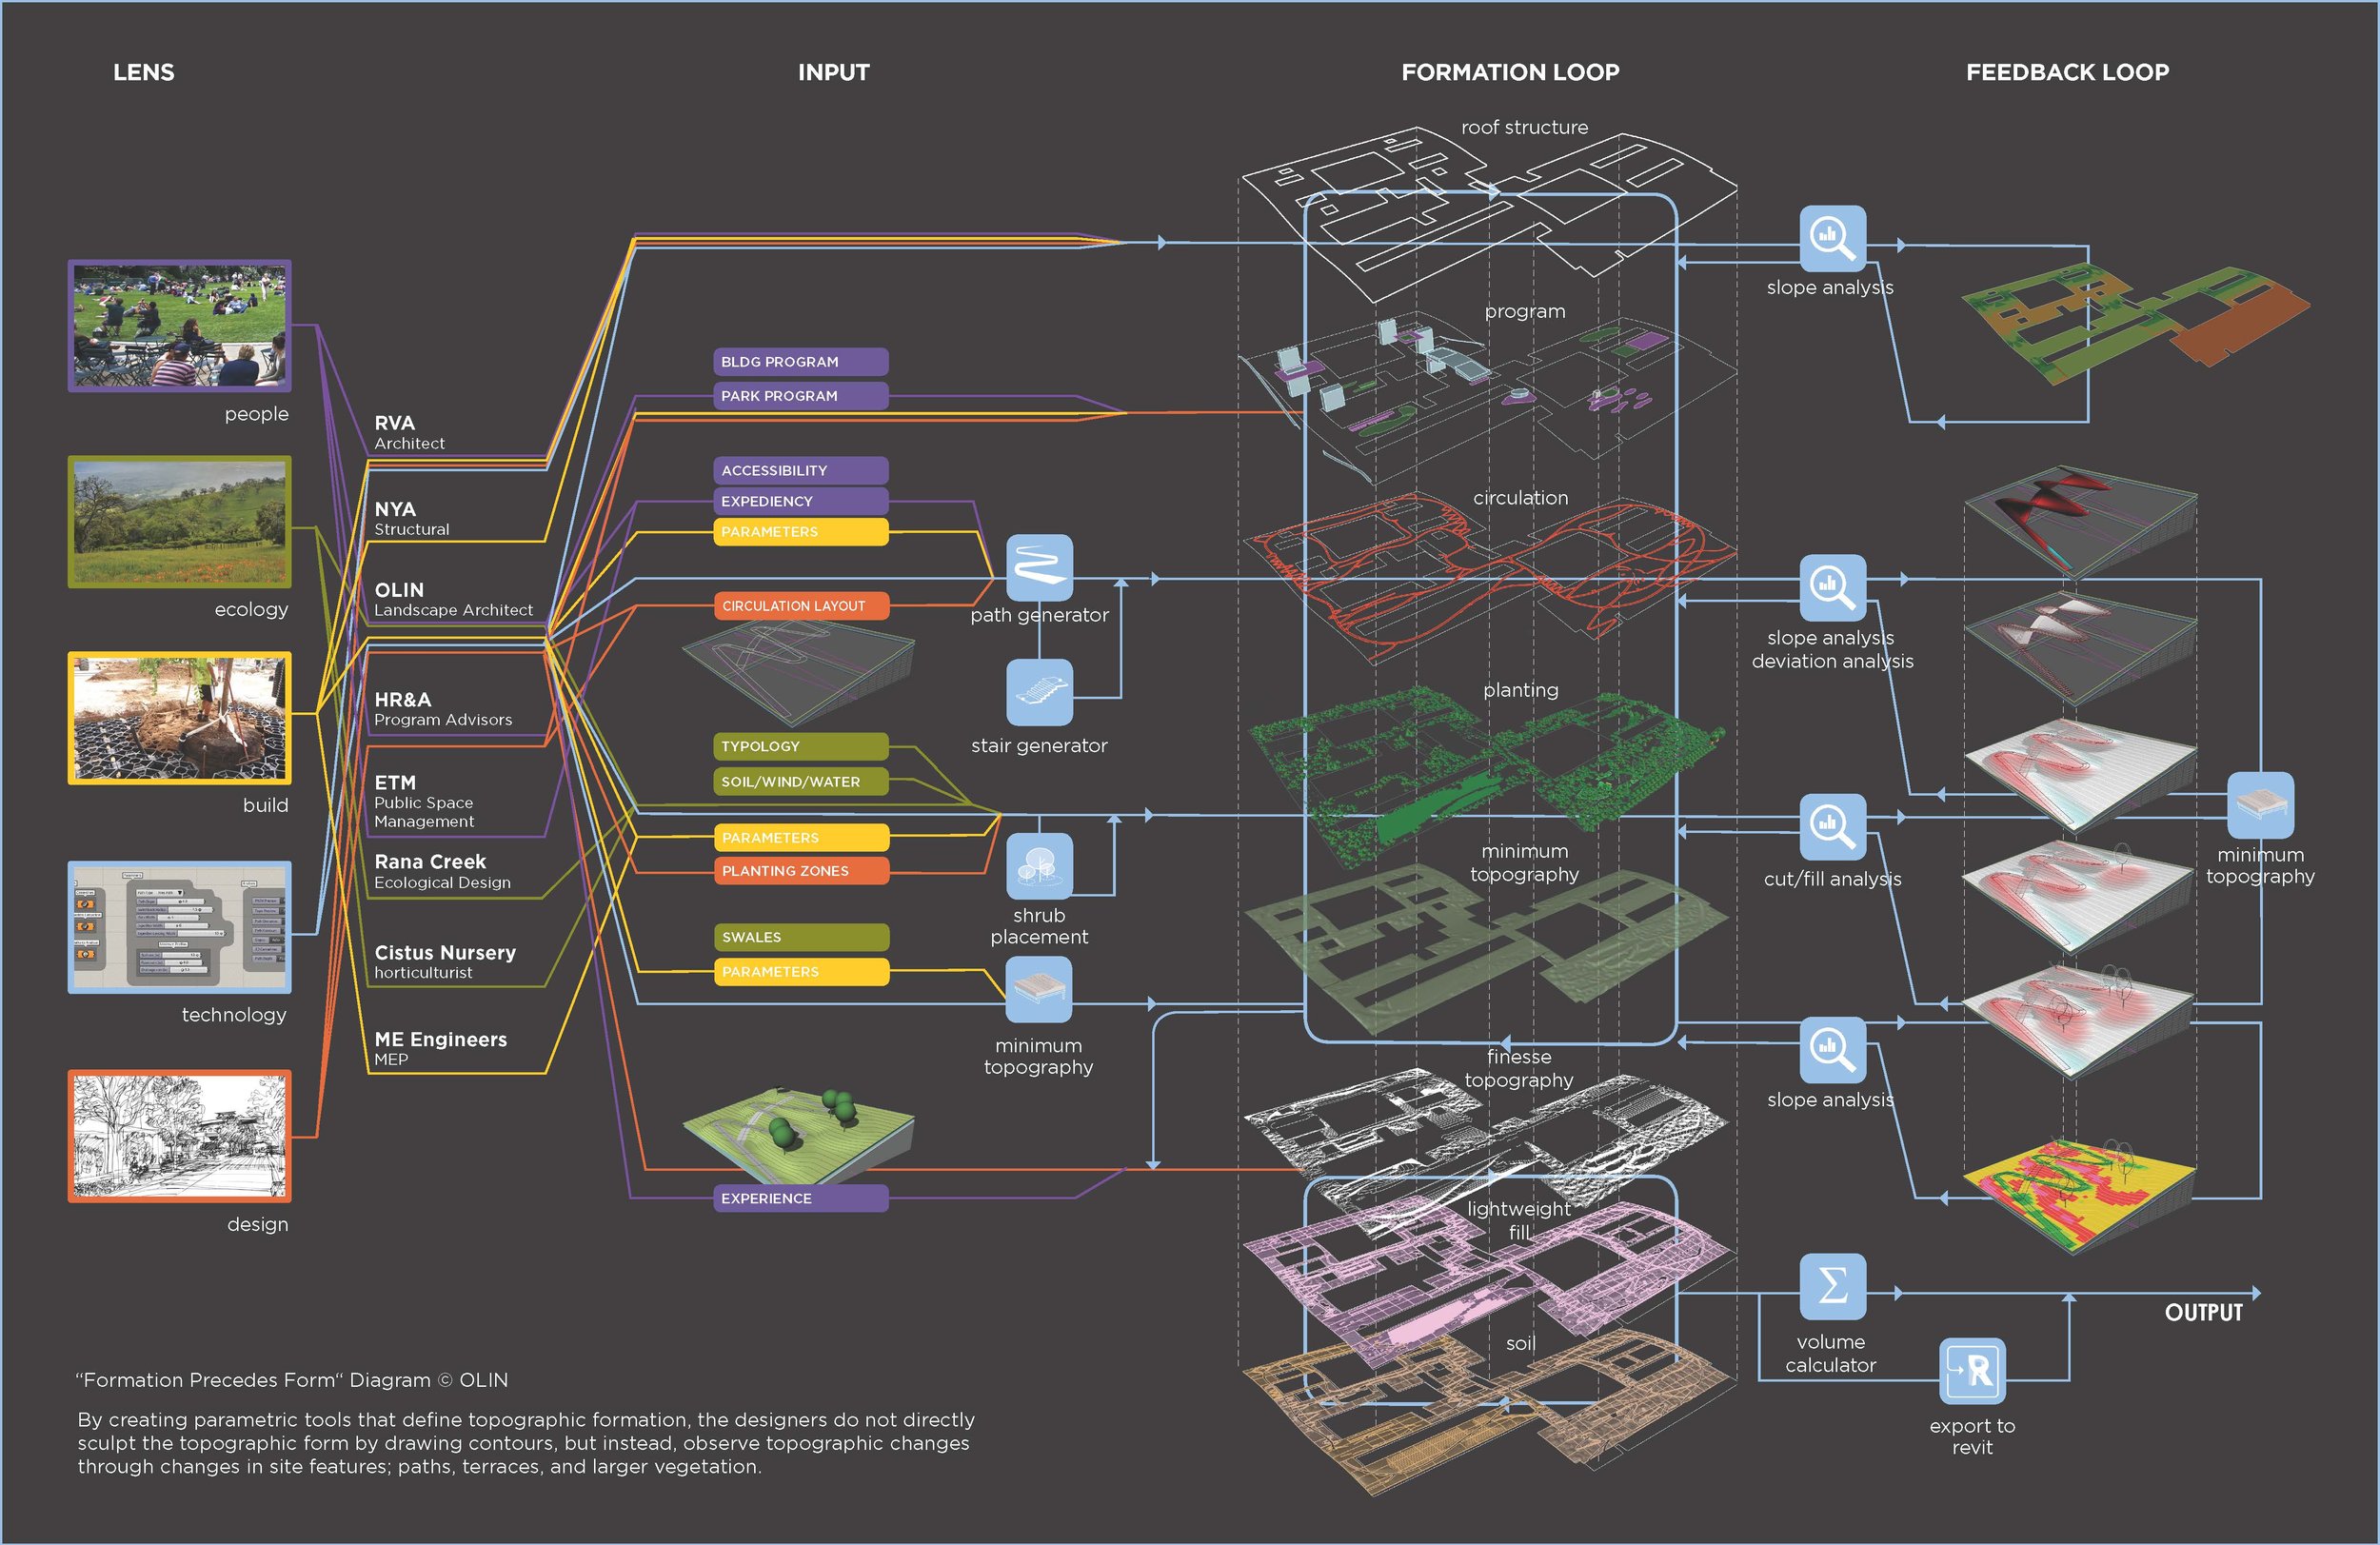
8
Palimpsest - Bandirma Park Master Plan